
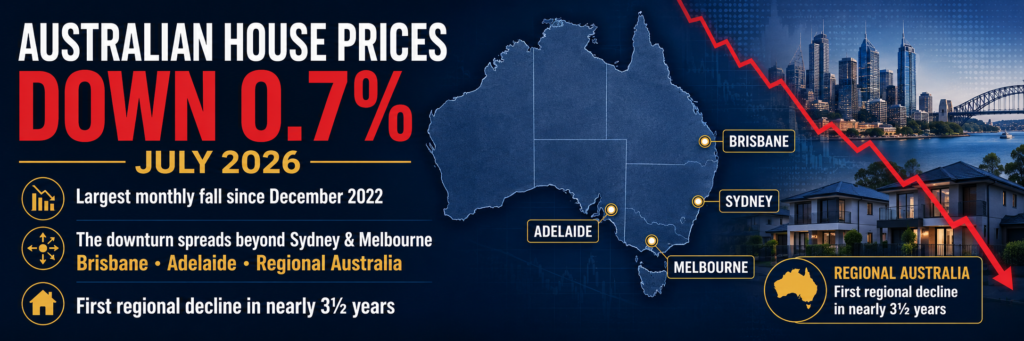
According to the latest national Home Value Index (HVI) released by Cotality, formerly CoreLogic, Australian home values fell by 0.7% in July 2026—the largest monthly decline since December 2022.
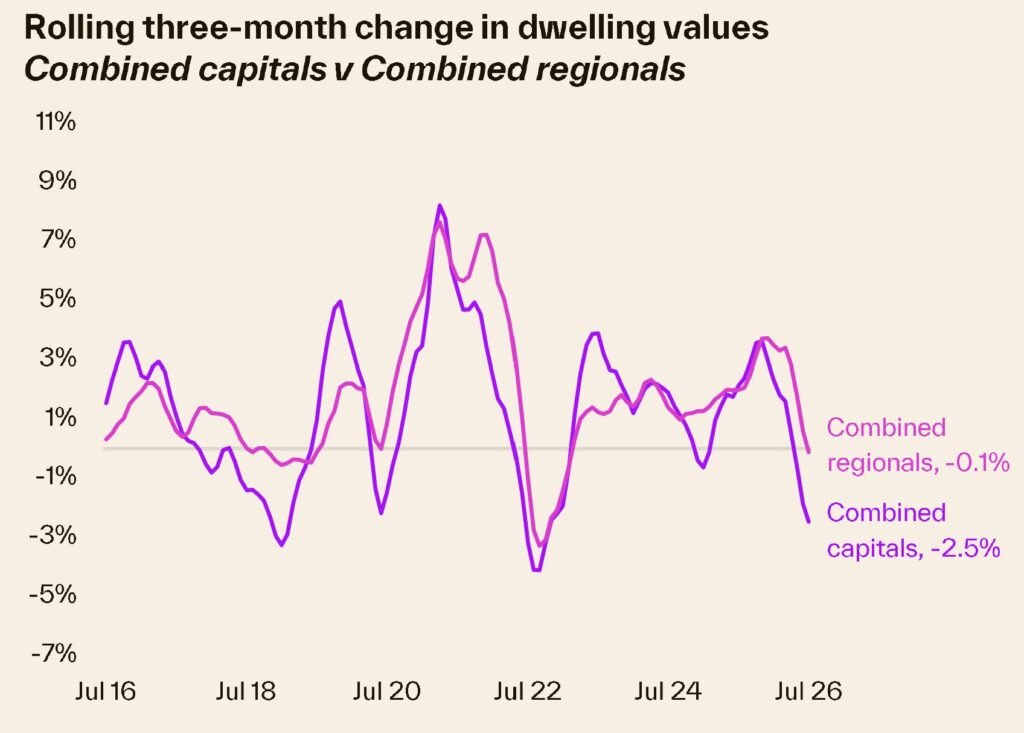
More importantly, the downturn is no longer limited to Sydney and Melbourne. As borrowing capacity declines, mortgage repayment pressure increases and consumer confidence weakens, previously resilient capital cities such as Brisbane and Adelaide have also begun to record falling values. Even regional markets, which had remained resilient for an extended period, experienced their first decline in nearly three and a half years.
Has Australia’s property market entered a broad-based correction? Which cities and types of property face the greatest pressure? With rents continuing to rise, is residential property still worth investing in?
This article provides a detailed analysis.
National home values fall by 0.7%, led by Sydney and Melbourne
Sydney and Melbourne remained the main contributors to the national decline in July.
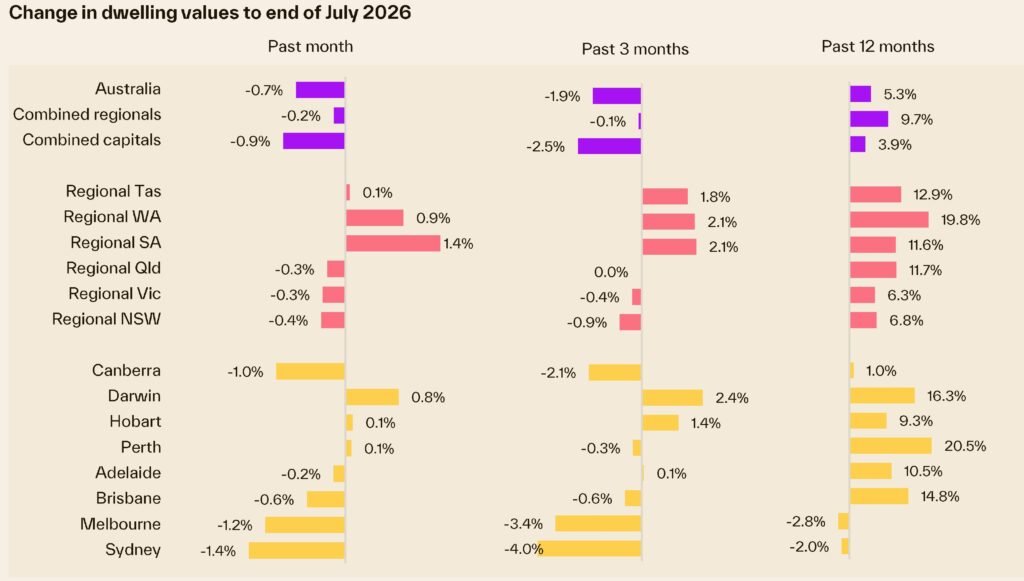
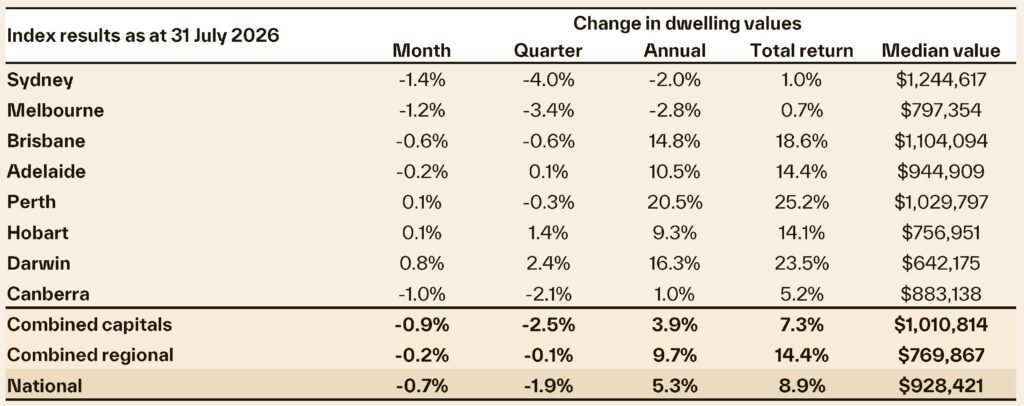
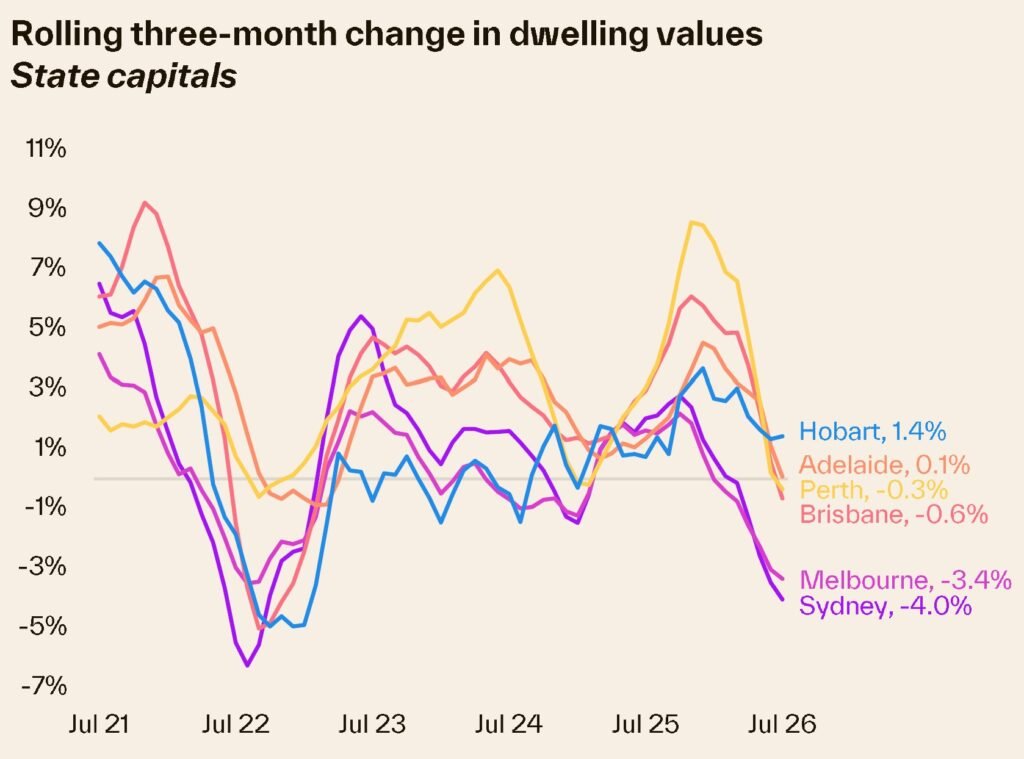
Sydney home values fell by 1.4% over the month, while Melbourne recorded a 1.2% decline. Melbourne values reached a recent peak in November 2025, while Sydney peaked in January 2026. Both cities have since entered a sustained period of adjustment.
Sydney and Melbourne are relatively sensitive to interest rate movements and have comparatively high property values. When borrowing capacity declines and mortgage repayments increase, higher-priced markets are usually the first to be affected.
However, the most significant development in July was not the continued decline in Sydney and Melbourne, but the spread of falling values to mid-sized capital cities that had previously performed strongly.
Brisbane home values fell by 0.6%, while Adelaide declined by 0.2%. Following revisions to historical data, both cities have now recorded falling home values for two consecutive months.
Perth’s position was slightly different. After revised data showed a 0.5% decline in June, values increased marginally by 0.1% in July. Although Perth has not yet entered a sustained downturn, its growth momentum has weakened considerably compared with the strong gains recorded in December last year and the March quarter this year.
This indicates that Australia’s property market correction is gradually shifting from a localised trend to a broader national slowdown.
High-value properties lead the decline, while lower-priced markets remain supported
The current decline is not evenly distributed across all price segments. It is concentrated primarily among higher-value properties.
Over the three months to the end of July, values across the most expensive 25% of Australian properties fell by a cumulative 3.2%. In comparison, values across the least expensive 25% still increased by 0.3%.
In other words, premium properties and higher-priced markets are under greater pressure, while entry-level properties continue to be supported by demand from budget-conscious buyers and first-home buyers.
There are several main reasons for this divergence.
First, higher interest rates have a greater impact on buyers taking out larger loans. Second, when banks tighten their borrowing capacity assessments, the pool of potential buyers for expensive properties can shrink rapidly. In addition, when the market outlook is uncertain, buyers tend to reduce their budgets and prioritise more affordable properties.
This also means that a property located in an expensive area, with a high proportion of investors and a rising number of listings, may face a greater risk of price correction than the broader market.
Historical data revised down as market conditions change rapidly
Cotality’s latest figures also show that home value declines in May and June were greater than initially reported.
Cotality Research Director Gerard Burg said the recent revisions reflected the speed at which conditions were changing across different markets, particularly in mid-sized capital cities that had previously performed strongly.
Perth recorded the most significant revision. In the latest update, Perth’s June growth rate was revised down by 120 basis points, turning what had been one of Australia’s fastest-growing markets into a declining market for that month.
During periods of rapid market change, property price indices can be subject to substantial revisions. This reminds buyers and investors not to make decisions based solely on the initial figures for a single month, but to consider trends over several consecutive months.
Why has Australia’s property market weakened so quickly?
The current correction has not been caused by a single factor. It reflects the combined effect of several pressures on housing demand.
Since late 2025, high property prices and household debt levels have increasingly constrained buyers’ borrowing capacity. In 2026, three interest rate increases have pushed mortgage costs even higher, while rising oil prices and broader cost-of-living pressures have further reduced household budgets.
At the same time, international geopolitical conflicts, weaker consumer confidence and uncertainty surrounding changes to government budget policies have caused some buyers to delay their purchasing decisions.
These pressures ultimately lead to the same outcome: fewer people can obtain sufficient finance, and fewer are willing to make offers under current market conditions.
Buyers generally adjust their expectations more quickly than sellers. They can immediately reduce their budgets, submit lower offers or temporarily leave the market. Sellers, however, often continue to rely on previous sale prices and may be reluctant to accept that market conditions have weakened.
The direct result is a mismatch between buyers’ and sellers’ price expectations.
Sellers are becoming cautious, but total listings continue to rise
Seller behaviour is also beginning to change.
Cotality’s weekly listings data shows that new listings have declined nationally in recent weeks, with the most noticeable change occurring in Sydney. After observing weaker market conditions, some potential sellers have decided to delay selling until conditions improve.
However, fewer new listings do not necessarily mean that housing supply is tight. As properties take longer to sell, unsold listings continue to accumulate, causing total stock levels to rise.
Over the four weeks to 26 July, the total number of Australian homes advertised for sale was only 1.1% below the five-year average. In mid-January, total listings had been 25.9% below the five-year average.
Across the combined capital cities, the number of properties currently listed for sale is now 5.7% above average.
This indicates that housing supply is recovering rapidly, while buyer demand has not increased at the same pace. For sellers, properties may take longer to sell. For buyers, it means more choice and greater negotiating power.
Auction clearance rates remain below 50%
The difference between buyer and seller expectations is also reflected in auction market results.
Since late May, the combined capital city auction clearance rate has remained below 50%. Although it has recovered from a low of approximately 40% in mid-to-late June, overall conditions remain weak.
A clearance rate consistently below 50% generally means that more than half of properties taken to auction fail to sell on the day. Some sellers may need to negotiate privately, reduce their price expectations or temporarily withdraw their properties from the market.
For prospective buyers, the market is gradually shifting from a seller’s market towards a buyer’s market. Buyers do not need to rush into making higher offers. They can compare properties more carefully, investigate potential issues and negotiate more favourable purchase terms.
Regional markets are also beginning to decline
Over the past several years, regional property markets have consistently outperformed the capital cities. However, the July figures indicate that weakening demand is now beginning to affect these markets as well.
Cotality’s combined regional home value index fell by 0.2% in July, its first monthly decline since January 2023.
Performance varied significantly between states:
- Regional New South Wales fell by 0.4%;
- Regional Victoria fell by 0.3%;
- Regional Queensland fell by 0.3%;
- Regional South Australia increased by 1.4%; and
- Regional Western Australia increased by 0.9%.
This demonstrates that regional Australia is not a single, uniform market. Some areas have begun to decline, while markets with limited housing supply and strong population growth continue to record increases.
Home values are falling, but rents continue to rise
In contrast to weakening home values, Australia’s rental market remains tight.
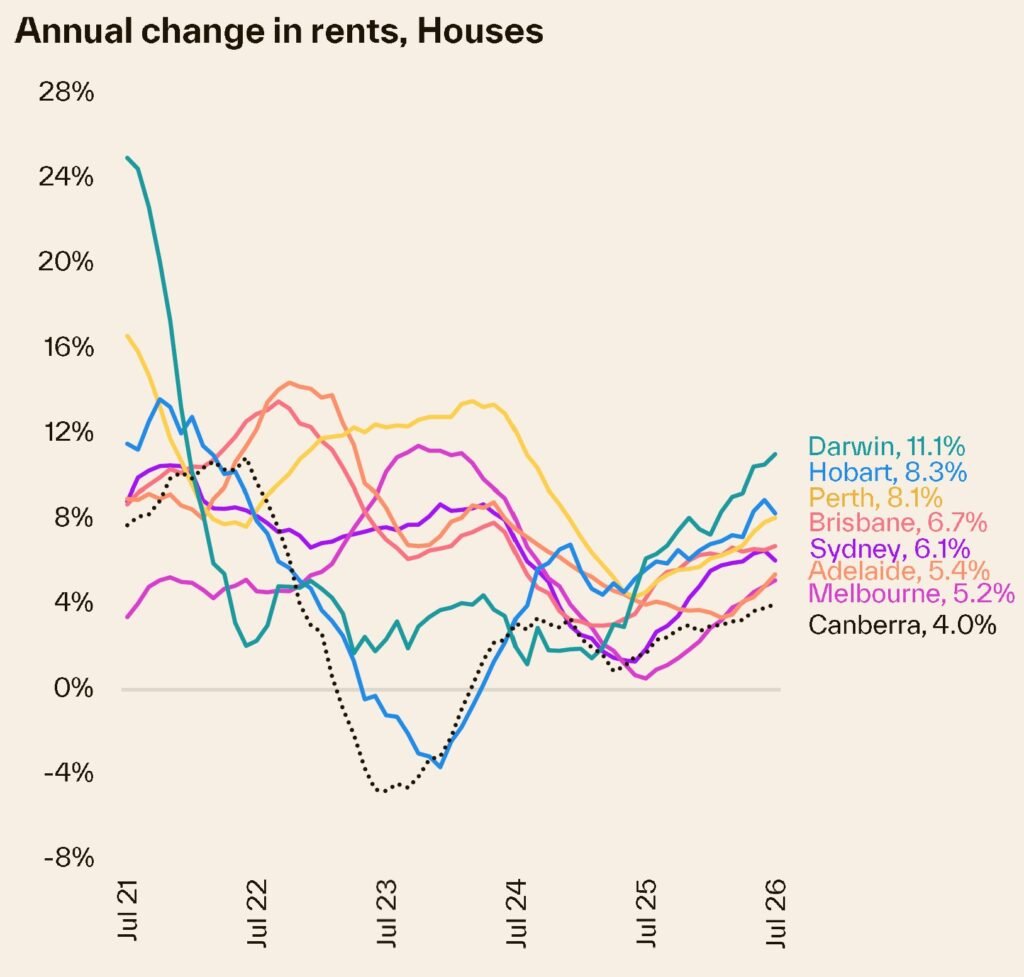
After seasonal adjustment, Cotality’s national rental index increased by 0.4% in July. Although monthly rental growth has slowed from its January peak, the annual growth rate remains at 5.9%, where it has remained for three consecutive months.
Based on median rents, Australian tenants are now paying an average of approximately $40 more per week than they were a year ago.
Among detached houses, the capital cities recording the highest annual rental growth were:
- Darwin: 11.1%;
- Hobart: 8.3%; and
- Perth: 8.1%.
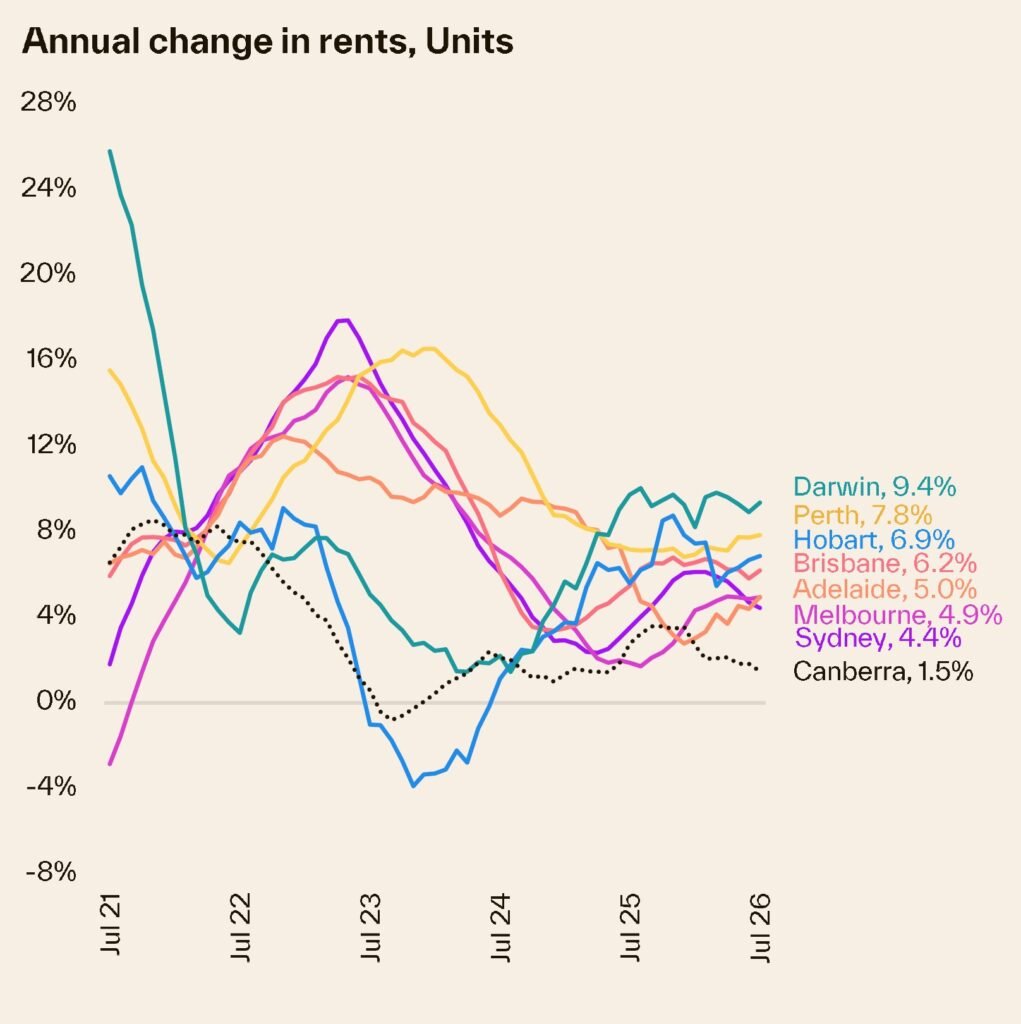
In the unit market, rents increased by 9.4% in Darwin and 7.8% in Perth, placing both cities among the strongest rental markets nationally.
The main reason rents continue to rise is the persistently low vacancy rate. Australia’s national rental vacancy rate increased slightly to 1.7% in July, compared with 1.6% in May and June, but remained well below the ten-year average of 2.4%.
As long as rental properties remain in short supply, rents are unlikely to decline significantly in the short term.
What are the gross rental yields across Australia?
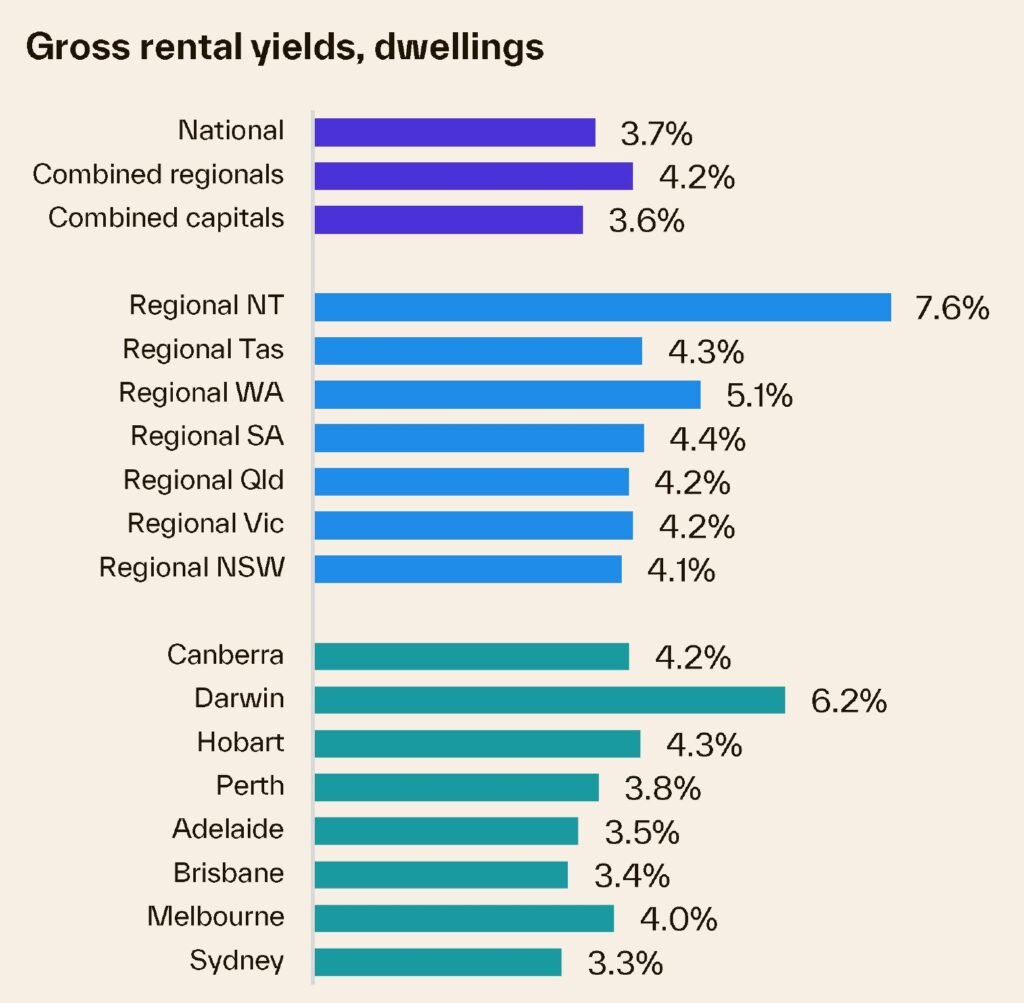
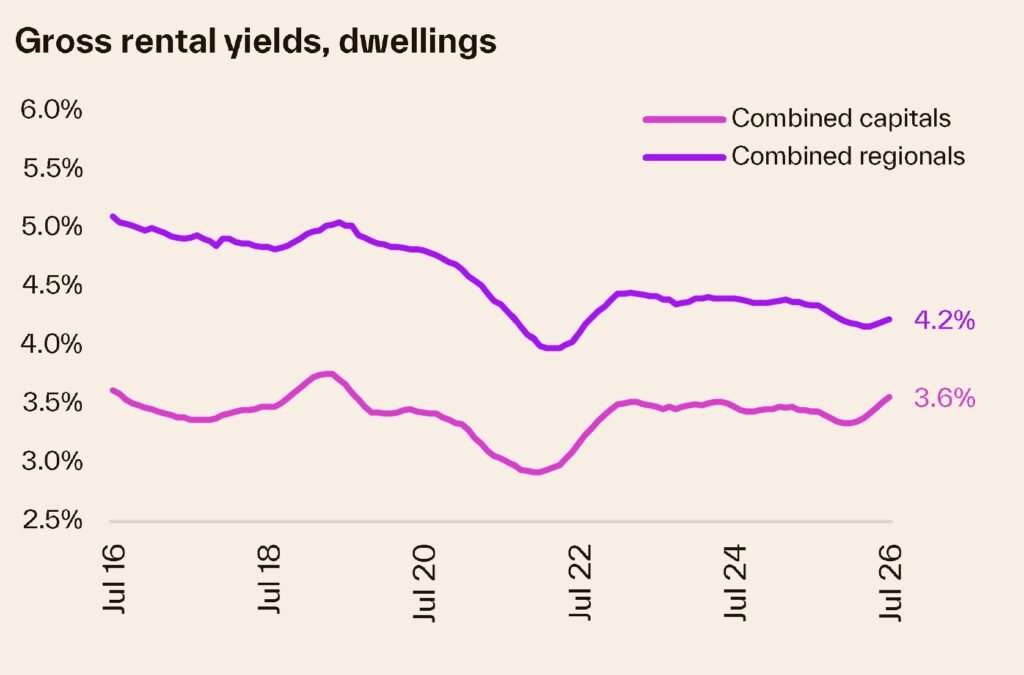
As rents rise and property values fall in some areas, Australia’s residential gross rental yield has improved.
The national gross rental yield is currently approximately 3.7%. The combined capital city yield is 3.6%, while the combined regional yield is 4.2%.
Gross rental yields across the capital cities are:
- Darwin: 6.2%;
- Hobart: 4.3%;
- Canberra: 4.2%;
- Melbourne: 4.0%;
- Perth: 3.8%;
- Adelaide: 3.5%;
- Brisbane: 3.4%; and
- Sydney: 3.3%.
Gross rental yields across regional markets are:
- Regional Northern Territory: 7.6%;
- Regional Western Australia: 5.1%;
- Regional South Australia: 4.4%;
- Regional Tasmania: 4.3%;
- Regional Queensland: 4.2%;
- Regional Victoria: 4.2%; and
- Regional New South Wales: 4.1%.
However, a higher rental yield does not necessarily mean that an investment property’s cash flow has improved.
Cotality noted that although rental yields have increased this year, the improvement has been far smaller than the rise in borrowing costs. As mortgage rates increase, the additional interest paid by investors may significantly exceed any increase in rental income.
In addition, proposed changes to negative gearing in the Federal Budget have affected how some potential investors calculate the returns from established properties. Under these policy expectations, a modest improvement in rental yields may not be sufficient to attract investors back into the market.
Will Australian home values continue to fall?
Based on the current data, national home values are likely to remain weak over the coming months.
Although the likelihood of further interest rate increases by the Reserve Bank of Australia has declined, the interest rate outlook remains uncertain. The latest Consumer Price Index data showed that the key measure of underlying inflation—the trimmed mean inflation rate—did not rise further in June and was below market expectations.
However, the RBA Governor maintained a tightening bias in her July remarks. This means that inflation and unemployment will be the two key indicators determining the direction of interest rates and the property market over the coming months.
If inflation continues to ease and the labour market remains stable, pressure on the RBA to increase rates further may decline. However, if inflation rises again or unemployment deteriorates significantly, pressure on the housing market could increase.
Could property prices experience a sharp collapse?
Although home values may continue to adjust, the risk of a sharp nationwide decline remains relatively low. Four main factors are currently providing support to the market.
First, the unemployment rate remains low. As long as most households maintain stable employment and income, the market is unlikely to experience a large number of forced sales.
Second, Australia’s population continues to grow. Additional population growth creates ongoing housing demand and supports both the sales and rental markets.
Third, construction costs remain high. Elevated building costs, limited project feasibility and slow supply growth are restricting the number of new homes being delivered.
Fourth, sellers are increasingly choosing to wait. If they cannot achieve their preferred price, some owners may delay selling, limiting any substantial further increase in advertised supply.
Australia’s property market is therefore more likely to experience an extended period of adjustment and divergent performance than a sudden, broad-based collapse.
Which markets face relatively higher risks?
The markets likely to face greater pressure include:
- Areas with high property valuations and heavily indebted buyers;
- Areas with a high proportion of investors that are more sensitive to changes in tax and lending policies;
- Areas where the number of properties for sale is increasing rapidly and selling times are becoming longer;
- Areas with substantial new housing supply but insufficient population and employment growth; and
- Premium housing markets with a relatively limited pool of buyers.
In comparison, markets with limited housing supply, continued population growth, stable employment and relatively affordable property prices may demonstrate greater resilience.
Final thoughts
Australia’s property market is currently undergoing a rapid transition.
Buyers are gaining more negotiating power, investors are reassessing their holding costs and future returns, and sellers are deciding between reducing their prices and delaying their listings.
For buyers, weaker market conditions provide more choice and greater negotiating opportunities. However, this does not mean that every property is worth purchasing. Location, housing supply, population growth, employment conditions and the quality of the property itself remain critical to its long-term value.
For sellers, sale prices achieved over the past several years may no longer accurately reflect current market conditions. Setting a realistic price and adjusting expectations promptly will be crucial to achieving a successful sale.
For investors, rising rents should not be considered in isolation. Interest rates, cash flow, tax policies, property expenses and future capital growth prospects must all be taken into account.
Over the coming months, unemployment, inflation and the RBA’s policy direction will determine whether the current property market adjustment remains a moderate correction or becomes more widespread.
Do you believe Australian home values will continue to fall? Will Sydney and Melbourne be the first markets to stabilise, or will Brisbane, Adelaide and Perth face greater adjustment pressure?
Please share your views in the comments. Follow Fundland Finance for data-driven insights into the realities of Australia’s property market.
Disclaimer: The information above is general in nature and does not constitute personal lending advice.